Dear Voltswap Community,
Voltswap was launched in September 2021 on Meter Network. As a dex owned by its community, we have constantly looked at ways to make the incentive design more sustainable.
TL,DR;
Proposal to adapt APY determination for Voltswap pairs;
1. Base APY: Based on risk of impermanent loss borne by the liquidity providers (leverage statistical methods to identify historic impermanent loss and calculate projected impermanent loss)
2. Fee APY: Based on historical fees generating by the pair
3. Boost APY: Based on liquidity providers participation in governance proposal to get additional returns
Outcome of the Analysis:
| Pairs | Base APY | Fee APY | Boost APY | Overall APY |
|---|---|---|---|---|
| MTRG-VOLT | 60.0% | 8.0% | 40.0% | 108.0% |
| MTRG-BUSD.bsc | 40.0% | 29.0% | 30.0% | 99.0% |
| BUSD.bsc-VOLT | 50.0% | 10.0% | 30.0% | 90.0% |
| BUSD.bsc-WETH.eth | 7.0% | 6.5% | 15.0% | 28.5% |
| MTRG-WETH.eth | 40.0% | 10.0% | 30.0% | 80.0% |
| BUSD.bsc-USDC.eth | 10.0% | 1.0% | 5.0% | 16.0% |
| WETH.eth-BNB.bsc | 7.5% | 1.5% | 7.5% | 16.5% |
| MTRG-MTR | 15.0% | 2.5% | 40.0% | 57.5% |
| BUSD.bsc-USDT.eth | 10.0% | 1.9% | 5.0% | 16.9% |
| MTRG-AMPL | 50.0% | 2.0% | 40.0% | 92.0% |
| WETH.eth-WBTC.eth | 7.5% | 0.7% | 7.5% | 15.7% |
| MTRG-MOVR | 15.0% | 6.8% | 15.0% | 36.8% |
Below is the shorter version of the attached analysis report;
1. Key Goal – Sustainability of the protocol
a. Past efforts
i. Reduced incentive period from 90 days to 30 days for better alignment
ii. Analysis of the performance of pairs (Liquidity, transaction volume) for the continuation
of VOLT allocation to the pair
2. The issue with the current VOLT allocation approach
a. Continuation of initial VOLT allocation from the first cycle with reduction or increase in
rewards based on the performance of pair
b. Leading performance of pairs in terms of Liquidity, transaction Volume (VOLT allocation
made without subsequent increase in TVL or volume)
c. Delinked to the risk borne by the user in providing liquidity
3. Redefine core ideology
a. ‘Provide a source of passive income to the community.’
b. Passive income to address the risk of impermanent loss
c. Passive income = APY to address risk impermanent loss + APY to generate fixed income
d. Impermanent loss is not equal to total loss
e. Provision of liquidity only if users have conviction in long term success of the asset
4. Introduction of 2 variables in VOLT allocation to a pair with the new ideology
a. How do we determine the impermanent loss : Statistical Analysis of past performance
i. The truth is – no one can predict the markets! However, with a large enough
historical data set, one can square down the potential risk in a liquidity position
ii. We plan to define the potential risk in a liquidity position through 2 statistical parameters:
1. Correlation:
2. Normal Distribution and Standard Deviation
iii. Since the statistical methods can introduce errors due to the fitment of the data as well
as the ability of the person doing the evaluation, we can try to introduce a buffer over the
APYs determined through the statistical methods
iv. With the inputs from the statistical methods, we will try to determine the risk associated
with a pair and determine the
b. How do we determine a fair APY to generate fixed income for the liquidity providers:
User participation in the governance process
i. With this discussion, we intend to outline the importance of community participation in the
governance process and the ability to take control of the volt emission
ii. With the initial APY determined through the statistical process to address impermanent
loss with some buffer, users should have the capability to boost the APY based on their
VOLT holdings in liquidity and staking.
5. Benefits of the proposal: The VOLT distribution can now
a. Be proportional to the risk borne by the liquidity providers in terms of potential impermanent
loss thus incentivizing pairs fairly
b. Arm governance with an ability to fairly distribute volt supply and the ability to incentivize
based on
i. capital inflow into the Voltswap ecosystem
ii. additional partnerships with new protocols
iii. smoothen the effect of annual emission halving’s
c. Be a lagging indicator to liquidity and transaction volume rather than a leading indicator
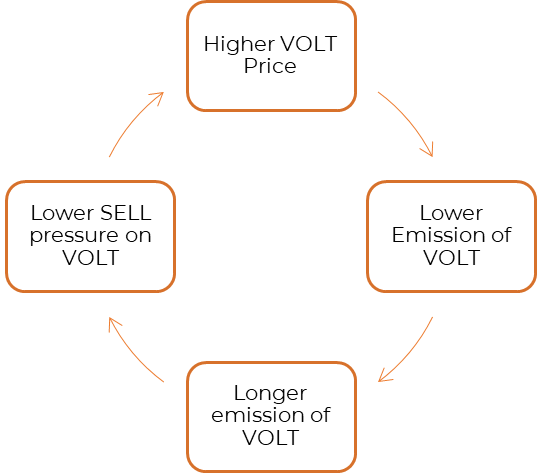
d. Provide a reinforcement effect to the VOLT price while ensuring good passive income
6. Operational parameters of new Proposal
a. Define impermanent loss risk associated with a pair
i. Low, Medium, High
b. Determine Base APY based on Historical and projected risk
i. This Base APY will not change for a pair unless there is a change in the risk associated with
the pair
c. Determine Fee APY based on Historical Data
i. Quoted for reference, earned based on actual transactions on the pair
d. Determine Boost APY based on the idea of providing passive income to the users
i. The monthly governance proposal will have quadratic voting on each pair
ii. The First cycle can have lower VOTES required to get the full boost – e.g.: 100,000 Votes to
get full boost APY
iii. Boost APY provided will be based on pro-rata votes received by the pair
7. Statistical definitions with examples available in the attachment
-
Impermanent loss
-
Overall Loss
-
Relative Price Index/ Price Ratio (RPI)
a. Relative Price Index (RPI) is the ratio of the price of the assets in the pool
b. It is important to note that the impermanent loss is dependent on the relative price index
of the assets for which liquidity is provided and not the absolute price of the assets
c. The percent impermanent loss remains the same for a relative price index irrespective of
the actual price (Impermanent loss is same for same RPI of 2 irrespective of prices of
both assets – 2 USD, 1 USD or 4 USD, 2 USD) -
Correlation
-
Normal Distribution
a. Before applying normal distribution characteristics to the relative price index of any pair,
we will confirm the applicability of data to the normal distribution by performing the
below checks
i. Mean and Median are relatively closer
ii. Skewness of the data sample is less than ±2
iii. Kurtosis of the data sample is less than ±2
iv. Percent of data following with 1 standard deviation
b. All the statistical data will be applied to the Relative price index since it drives the
impermanent loss
c. Following parameters are defined in the attachment
i. Mean
ii. Median
iii. Standard Deviation
iv. Kurtosis
v. Skewness
vi. Range
vii. Data within ±1 standard deviation
The analysis of the pairs is available in the attachment. Analysis of the first pair showcased for reference
- Correlation Data

Understandably, since BUSD is a stablecoin, there is no significant correlation between the price level of MTRG and BUSD over any period.
- Normal Distribution Data
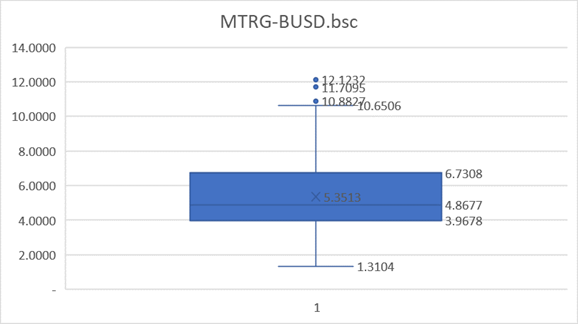
In the BOX-WHISKERS plot, 50% of the data falls with the relative price index of 3.97 and 6.73

Historical data indicates that the previous relative price index data for the pair has followed normal distribution to some extent. However, we have to take this information with a pinch of salt since one of the assets is a stablecoin.
- Historical Impermanent Loss (All estimates at 10,000 USD initial investment)

- Projected Data based on normal distribution assumption

- Previous cycle APY (@current volt price)
Across both – historical and projected data, we see that the max APY required to recover any impermanent loss until now is ~69%. However, that recovery is at the price level of 12 USD per MTRG. With the current price of MTRG, we would be in a position to update the APY in case of a significant rise in the price of MTRG.
- Proposal
| Paramter | Value |
|---|---|
| Risk rating of PAIR | High Risk |
| Base APY suggestion for the pair | 40% |
| Historical Fee APY | 29% |
| Boost APY Potential through VOLT voting | 30% |
| Overall APY | 99% |
-
Correlation Data
The correlation between the assets increases over a broader horizon. This is expected as both are appreciating assets. However, over a shorter duration, there is greater volatility in MTRG in comparison to WETH leading to a lower correlation. -
Normal Distribution Data
In the BOX-WHISKERS plot, 50% of the data falls with the relative price index of 632.62 and 863.36. The recent drawdown on MTRG price has been classified as outliers in the plot because the relative price index is ongoing for a shorter duration than other available data
Historical data indicates that the previous relative price index data for the pair does not follow a normal distribution and is right-skewed. This shows similar insight as to the box-whiskers plot which defined >1200 Relative price index as outliers. -
Historical and Projected Impermanent Loss
Across both – historical and projected data, we see that the max APY required to recover any impermanent loss until now is ~45%. However, that recovery is at the price level of 12 USD per MTRG. With the current price of MTRG, we would be in a position to update the APY in case of a significant rise in the price of MTRG. -
Proposal
| Paramter | Value |
|---|---|
| Risk rating of PAIR | High Risk |
| Base APY suggestion for the pair | 40% |
| Historical Fee APY | 9.76% |
| Boost APY Potential through VOLT voting | 30% |
| Overall APY | 79.76% |
-
Correlation Data
With the low MTR circulation supply, MTRG-MTR has historically shown a higher correlation. However, as circulating supply increases or miner activity increases, we anticipate a similar correlation trend as with other stablecoin pairs. -
Normal Distribution Data
In the BOX-WHISKERS plot, 50% of the data falls with the relative price index of 0.4440 and 0.6381
Historical data indicates that the previous relative price index data for the pair has close MEAN and MEDIAN as well as low skewness and kurtosis value. However, the RPI data within 1 standard deviation is only 40%. Also, as MTR is intended to be a metastable currency, the normal distribution would not last over a broader horizon. -
Historical and Projected Impermanent Loss
Across both – historical and projected data, we see that the max APY required to recover any impermanent loss until now is ~15%. -
Proposal
| Paramter | Value |
|---|---|
| Risk rating of PAIR | Medium Risk |
| Base APY suggestion for the pair | 15% |
| Historical Fee APY | 2.50% |
| Boost APY Potential through VOLT voting | 40% |
| Overall APY | 57.50% |
Higher boost potential to promote MTR liquidity and mining.
-
Correlation Data
Understandably, since BUSD is a stablecoin, there is no significant correlation between the price data -
Normal Distribution Data
In the BOX-WHISKERS plot, 50% of the data falls with the relative price index of 4162.78 and 3075.42
Historical data indicates that the previous relative price index data for the pair has close MEAN and MEDIAN as well as low skewness and kurtosis value. However, the RPI data within 1 standard deviation is only 26%. This is expected for a pair containing an appreciating asset and a stablecoin to not have a normal distribution. -
Historical and Projected Impermanent Loss
Across both – historical and projected data, we see that the max APY required to recover any impermanent loss until now is ~7%. This is across a massive increase in price from 2400 to 4800 USD for WETH -
Proposal
| Paramter | Value |
|---|---|
| Risk rating of PAIR | Low Risk |
| Base APY suggestion for the pair | 7% |
| Historical Fee APY | 6.50% |
| Boost APY Potential through VOLT voting | 15% |
| Overall APY | 28.50% |
-
Correlation Data
Despite being appreciating assets, there is a remarkably low correlation between the assets across all time horizons. -
Normal Distribution Data
In the BOX-WHISKERS plot, 50% of the data falls with the relative price index of 0.0302 and 0.0159
Historical data indicates that the previous relative price index data for the pair has close MEAN and MEDIAN as well as low skewness and kurtosis value. Even the RPI data within 1 standard deviation is ~63%. The historic data set does follow normal distribution closely. -
Historical and Projected Impermanent Loss
Across both – historical and projected data, we see that the max APY required to recover any impermanent loss until now is ~29%. However, that data is at a relative price index of 0.01 with a low probability of occurrence within 1 month. We can update the APY in the next cycles if required. -
Proposal
| Paramter | Value |
|---|---|
| Risk rating of PAIR | Medium Risk |
| Base APY suggestion for the pair | 15% |
| Historical Fee APY | 6.78% |
| Boost APY Potential through VOLT voting | 15% |
| Overall APY | 36.78% |
-
Correlation Data
Both being the top tokens and blue chips, WETH and WBTC have very high correlation across all time horizons. The correlation is low in the 1-year time horizon due to ETH outperforming BTC within this time frame. -
Normal Distribution Data
In the BOX-WHISKERS plot, 50% of the data falls with the relative price index of 0.0328 and 0.0698
Historical data indicates that the previous relative price index data for the pair does not have a close MEAN and MEDIAN as well as low skewness. The low kurtosis value demonstrates that there are fewer outliers in the tail end of the data. The high negative skewness to the left is again due to the better performance of ETH in comparison to WBTC in the past year. The RPI data within 1 standard deviation is ~56%. The historic data set does not follow the normal distribution closely. -
Historical and Projected Impermanent Loss
Across both – historical and projected data, we see that the max APY required to recover any impermanent loss until now is ~15%. However, that data is at a relative price index of 0.024 with a low probability of occurrence due to the performance of ETH. We can update the APY in the next cycles if required. -
Proposal
| Paramter | Value |
|---|---|
| Risk rating of PAIR | Low Risk |
| Base APY suggestion for the pair | 7.5% |
| Historical Fee APY | 0.66% |
| Boost APY Potential through VOLT voting | 7.5% |
| Overall APY | 15.66% |
-
Correlation Data
Both being the top tokens and blue chips, WETH and BNB have a very high correlation across all time horizons. -
Normal Distribution Data
In the BOX-WHISKERS plot, 50% of the data falls with the relative price index of 0.1443 and 0.0682
Historical data indicates that the previous relative price index data for the pair does not have a close MEAN and MEDIAN but has a very low skewness and kurtosis value. Even the RPI data within 1 standard deviation is ~68%. The historic data set does follow normal distribution closely. -
Historical and Projected Impermanent Loss
Across both – historical and projected data, we see that the max APY required to recover any impermanent loss until now is ~28%. However, that data is at a relative price index of 0.03 with a low probability of occurrence due to a higher correlation between the assets for past years. We can update the APY in the next cycles if required. -
Proposal
| Paramter | Value |
|---|---|
| Risk rating of PAIR | Low Risk |
| Base APY suggestion for the pair | 7.5% |
| Historical Fee APY | 1.53% |
| Boost APY Potential through VOLT voting | 7.5% |
| Overall APY | 16.53% |
-
Correlation Data
Understandably, since AMPL is an algorithmic stablecoin, there is no significant correlation between the price data -
Normal Distribution Data
In the BOX-WHISKERS plot, 50% of the data falls with the relative price index of 5.9942 and 4.1384
Historical data indicates that the previous relative price index data for the pair has close MEAN and MEDIAN as well as low skewness and kurtosis value. However, the RPI data within 1 standard deviation is only 32%. This is expected for a pair containing an appreciating asset and an algorithmic stablecoin to not have a normal distribution. -
Historical and Projected Impermanent Loss
Across both – historical and projected data, we see that the max APY required to recover any impermanent loss until now is ~57%. However, that recovery is at the price level of 10 USD per MTRG. With the current price of MTRG, we would be in a position to update the APY in case of a significant rise in the price of MTRG. -
Proposal
| Parameter | Value |
|---|---|
| Risk rating of PAIR | High Risk |
| Base APY suggestion for the pair | 50% |
| Historical Fee APY | 2% |
| Boost APY Potential through VOLT voting | 40% |
| Overall APY | 92% |
-
Correlation Data
The drop in volt price has resulted in a lower correlation between MTRG and VOLT. -
Normal Distribution Data
In the BOX-WHISKERS plot, 50% of the data falls with the relative price index of 26.3766 and 14.5210
Historical data indicates that the previous relative price index data for the pair has close MEAN and MEDIAN as well as low skewness and kurtosis value. Even the RPI data within 1 standard deviation is only 67%. The pair does follow normal distribution closely -
Historical and Projected Impermanent Loss
Across both – historical and projected data, we see that the max APY required to recover any impermanent loss until now is ~155% and ~313%. However, these APY are at a VOLT price of 5 USD which was only witnessed in the first 2 days of Voltswap listing. A closer approximation of 1 USD price of VOLT makes the impermanent loss at 30% -
Proposal
| Paramter | Value |
|---|---|
| Risk rating of PAIR | High Risk |
| Base APY suggestion for the pair | 60% |
| Historical Fee APY | 8% |
| Boost APY Potential through VOLT voting | 40% |
| Overall APY | 108% |
-
Correlation Data
Understandably, since BUSD is a stablecoin, there is no significant correlation between the price data -
Normal Distribution Data
In the BOX-WHISKERS plot, 50% of the data falls with the relative price index of 5.1442 and 2.8429
Since the pair contains a stablecoin, it would not be characterized by a normal distribution. -
Historical and Projected Impermanent Loss
Across both – historical and projected data, we see that the max APY required to recover any impermanent loss until now is ~320%. However, these APY are at a VOLT price of 5 USD which was only witnessed in the first 2 days of Voltswap listing. A closer approximation of 0,4 USD price of VOLT (BUSD-VOLT pair was only started in December 2021) makes the impermanent loss at 33% -
Proposal
| Paramter | Value |
|---|---|
| Risk rating of PAIR | High Risk |
| Base APY suggestion for the pair | 50% |
| Historical Fee APY | 10% |
| Boost APY Potential through VOLT voting | 30% |
| Overall APY | 90% |